In our today's tutorial, we will look at how to customize the Windows 11 Task Manager and change columns you see on its pages, and other options.
Advertisеment
The Window 11 Task Manager is an essential tool that allows managing processes and apps running in the OS and see their details. It displays a lot of useful information in summary and for each of the app individually. You can quickly find the resource usage, terminate a process, or even manage startup app.
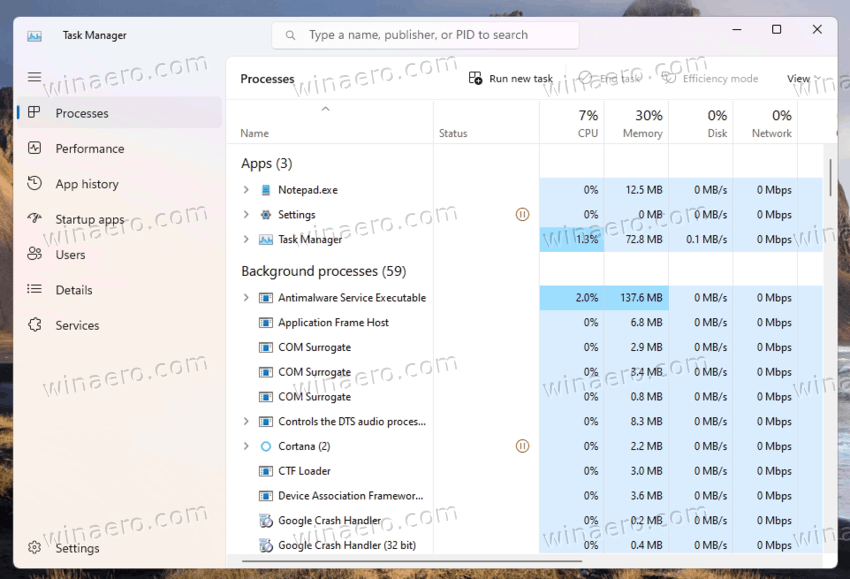
Microsoft is actively working on the app. For example, it has got a search box to quickly find a process by its name, publisher or PID.
While Task Manager doesn't include plenty of customization options, you may be surprised how many things you may change. For your convenience, you can change the startup page, as we reviewed in a previous post. Also, by adding and removing columns for each of the pages you can see details you could not be aware of.
Add or Remove Columns in Windows 11 Task Manager
You can make Task Manager more informative by adding more columns with extra information. You can also remove the columns you never use to get more room for other useful data.
To add or remove columns in Task Manager, do the following.
- Switch to the Task Manager tab you want to customize the columns for.
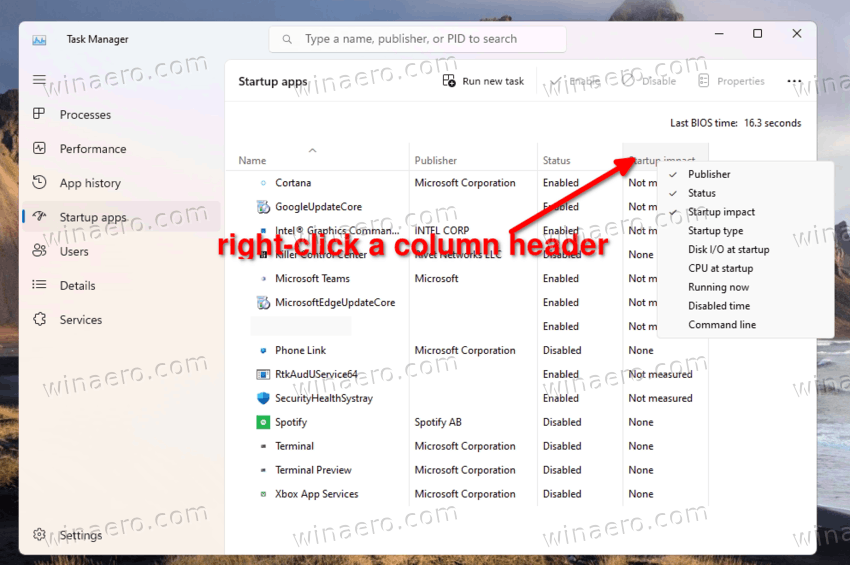
- Right-click the header of any column to open the context menu.
- From the menu, select (check) the columns that should be visible.
- Now, right-click again any column's header and select a checked column name to remove it from the set, i.e. to hide it.
- Repeat the steps 2-4 for all columns you want to show or hide in the Task Manager on the current tab.
- Switch to the next tab and customize the columns in the same way. Note that the Services tab doesn't allow customizing its columns.
Done.
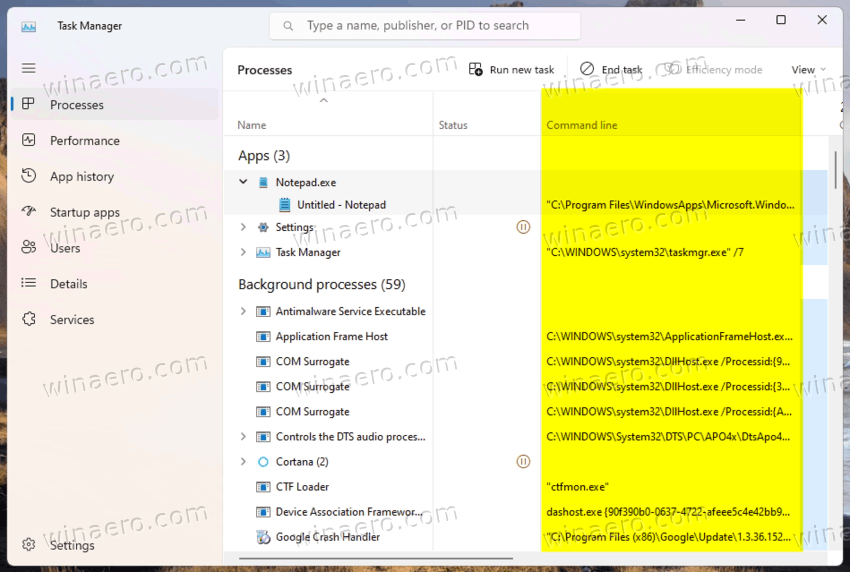
To illustrate the above procedure, let's add a useful command line column to the Task Manager. Sadly, the app doesn't display it by default. But may users still want to see what is the executable file and its argument for running apps. Well, the Command Line column shows exactly that info.
Add the Command Line column to Task Manager
- Open the Task Manager (Ctrl + Shift + Esc).
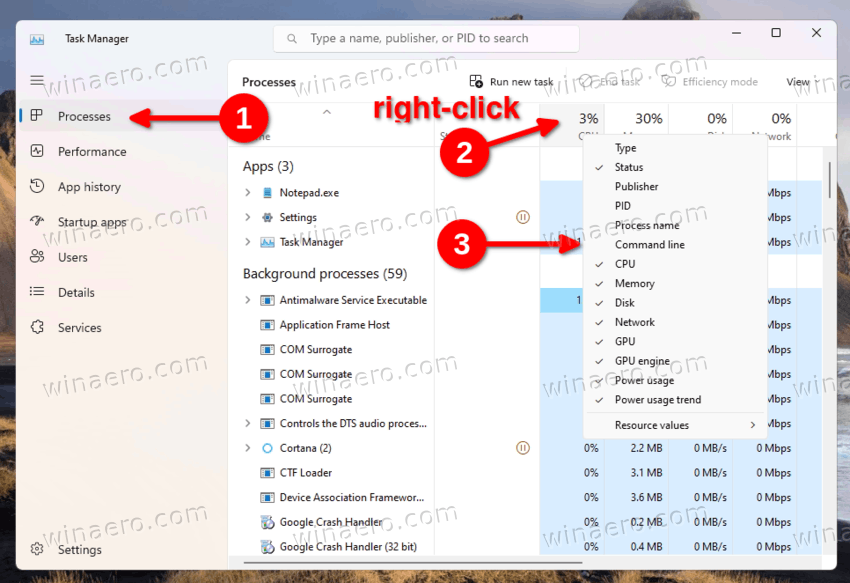
- Switch to the Processes column if it doesn't open to it.
- Right-click any header, e.g. Name, and select Command line from the menu to place a check mark for it. The column will appear instantly.
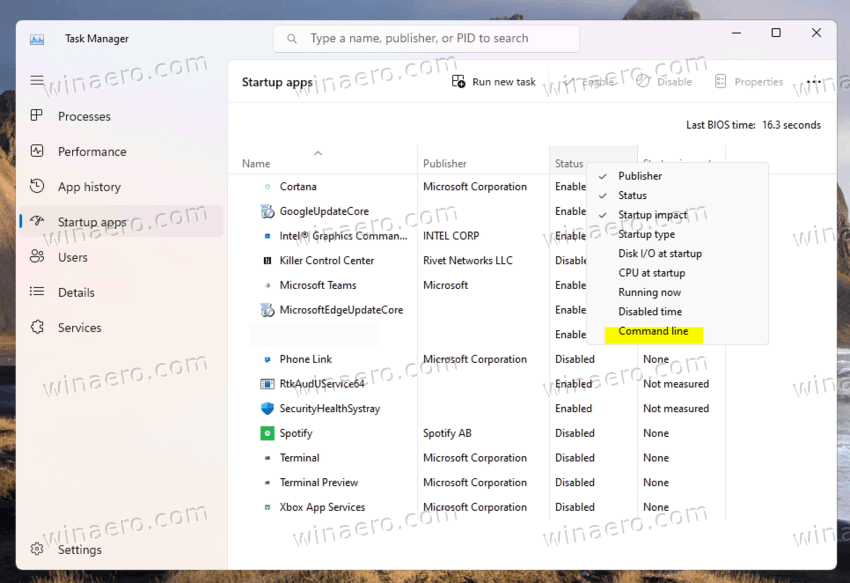
- Now, switch to the Startup apps tab.
- Right-click the Name column and similarly select Command line.
- Switch to the Details tab and right-click the Name header.
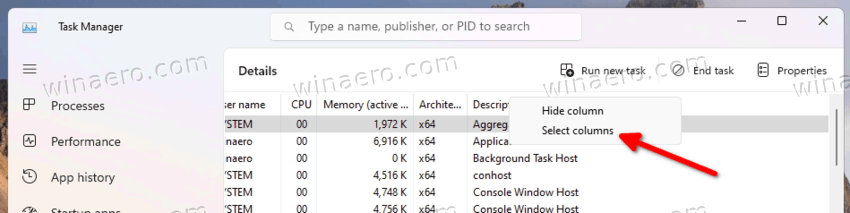
- On this very tab, you had to select "Select Columns" from the menu, as it supports many options that do not fit the context menu. It will open a new dialog.
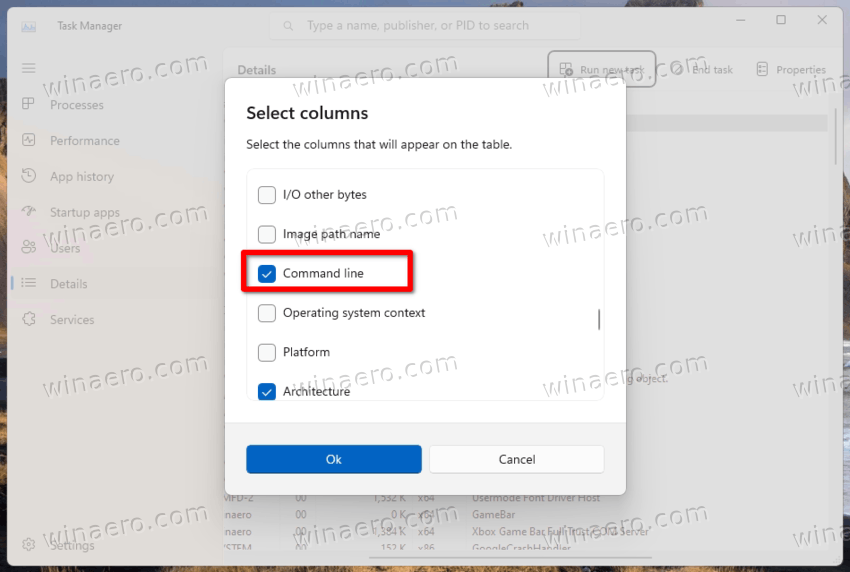
- There, find the Command line option, place a check mark next to it and click OK to add the column.
That's it. Now, all the tabs that supports showing the app command line will display it for you.
Available Task Manager Columns and Pages
Depending on the tab, the set of tabs you can select. Let's review the tabs you can show or hide.
Processes
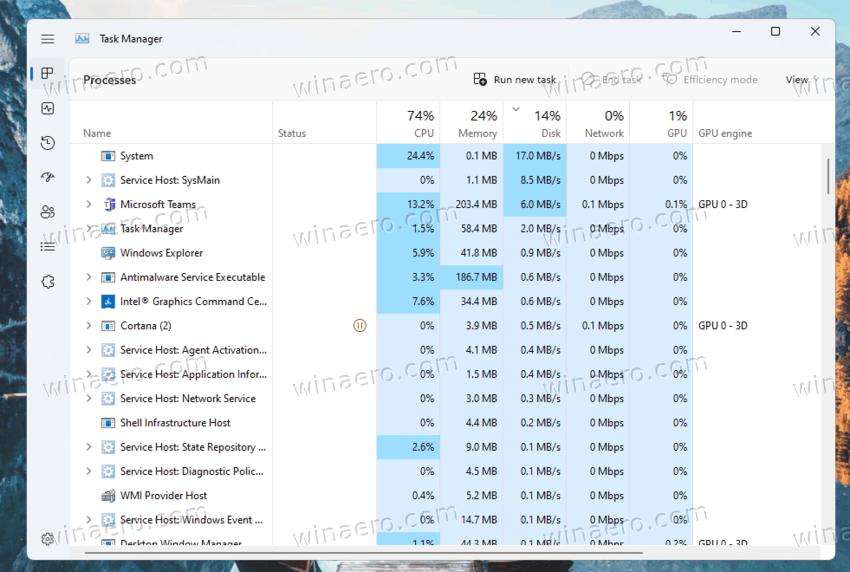
The Processes page displays a grid with running apps and background processes. For each of the processes, it shows CPU, RAM, disk, network, GPU, and other resource usage metrics. Here, you can show or hide the following columns.
- Type. Hidden by default. Shows if the app is a regular app, a process running in the background, or it is a Windows process.
- Status. Visible by default. Says “Not Responding” for hung apps. It can also display a pause icon for suspended apps, and a green leaves icon for apps in Efficiency mode (formerly Eco mode).
- Publisher. Hidden by default. Displays the name of the program’s author for signed processes. E.g. for Total Commander it will say "Ghisler Software", and "Winaero" for Winaero Tweaker.
- PID. Hidden by default. Contains the process identifier number Windows has assigned to the process. This number can be useful for debugging and process management tools such as taskkill. Each of the running processes has its unique ID.
- Process Name. Hidden by default. The executable file name of the process, for example,
explorer.exe. - Command Line. Hidden by default. Show the full path to the app's executable file and its launch arguments.
- CPU. Visible by default. Shows a percentage of the CPU usage for the processes.
- Memory. Visible by default. The amount of RAM used by the app in MB or GB.
- Disk. Visible by default. This columns displays the disk activity for a process in MB/s. For apps that do not write or read anything from the drive it contains a value of 0 MB/s.
- Network. Visible by default. The columns contains the bandwidth usage per process on the current active network. It shows the data in Mbps.
- GPU. Visible by default. This column shows the video resources an app is using from the graphics processing unit. The information is shownas a percentage of the overall resources of your GPU.
- GPU Engine. Visible by default. For devices with multiple GPUs, e.g. if you have a laptop, it shows which exactly GPU the app uses. It may say the line like "GPU 0 - 3D". Switch to the Performance > GPU page to see what are the numbers and names associated with your GPUs.
- Power Usage. Hidden by default. The column displays a summary power usage value calculated from the disk, GPU, and CPU resources utilized by the app. It might show the text like "Very low","Very high", and so on.
- Power Usage Trend. Hidden by default. The column shows the estimated impact by process on power usage. Similar to the previous column, but shows an average value over time. For example, if a process usually doesn't use a lot of system resources, but uses them right now, the Power Usage column will say "Very high", but the Power Usage Trend will continue to show "Very low".
Performance
The Performance page stands alone in the set of available tabs in Task Manager. It doesn't have a table or list of processes, but instead includes several graphs organized into categories. There are individual sections for CPU, memory, disk, network, and GPU. Each of the sections shows advanced details for your hardware and software. There are the name of your processor, type of the installed memory, GPU model and more.
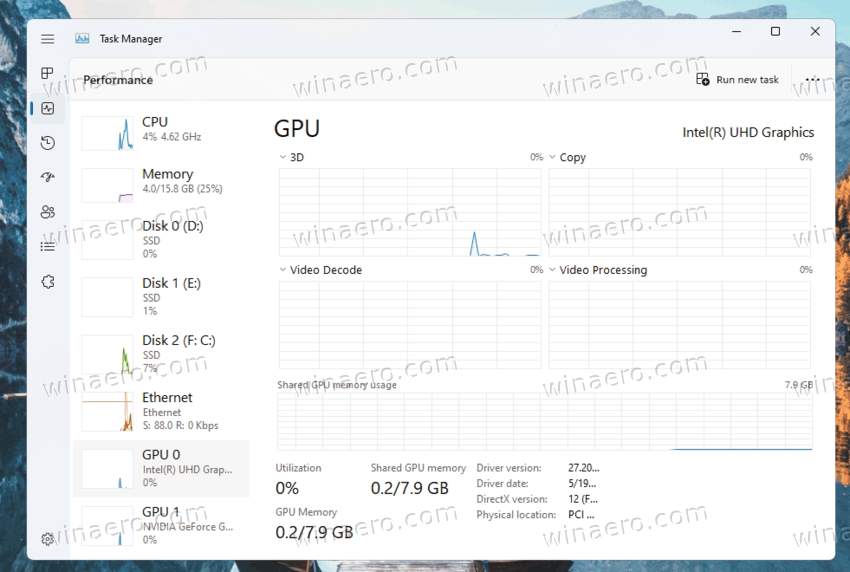
The sections have dynamic icons on the left that reflect the current resource usage values in tiny graphs. When you click on such icon, a full sized graph will appear on the right.
The Performance page has the following categories.
- CPU. Clicking on the CPU graph allows you to view the CPU model, its clock, number of cores, along with other details like virtualization, cache, and system uptime. The latter shows how long the system has been running.
- Memory displays the volume of RAM installed in your device. The details include its speed, and even the number of slots available on the motherboard (if any). Also on this section you will find how many RAM is cached to operate the software faster. If you see some "hardware reserved" value, this means that piece of RAM is used by integrated video adapter.
- Disk shows the model and capacity of your storage devices, and its type, e.g. SSD. You will also see its read and write speed.
- Ethernet/Wi-Fi. These two sections include details about your connectivity. There are the driver name, adapter type, adapter name, assigned network addresses, and the current traffic as well as network connection speed.
- The GPU sections will allow you to learn more about the installed video cards. There are several graphs for performance, encoding and decoding, and more. There are also details about the drivers, DirectX version, hardware details, and GPU temperature (if supported by the drivers). For each of the installed adapters you will have a dedicated GPU x section.
App history
The App history page shows resource usage details for Store apps. Here you will find how much network traffic this or that app consumed on regular and metered connections, and its CPU time. These values are accumulated since a specific date which is noted in the header. Here you can show or hide the following grid columns.
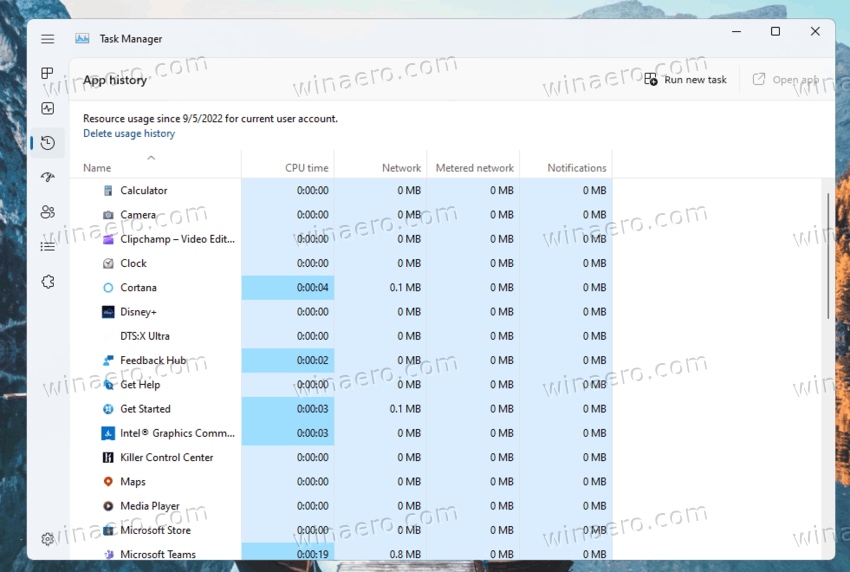
- Name. The column shows the friendly app name. It is mandatory and can't be hidden.
- CPU Time. Visible by default. Shows the amount of CPU time spent on executing the app.
- Network. Visible by default. The column contains amount of network traffic generated by the app, including downloads and uploads.
- Metered Network. Visible by default. If you have been using the app on a metered connection(s), you will see the amount of that traffic here.
- Non-metered Network. Hidden by default. The column shows the amount of network data transferred on regular connections.
- Downloads. Hidden by default. The network download activity by the app.
- Uploads. Hidden by default. The network upload traffic by the app.
Startup apps
This page of the Task Manager allows you to permanently prevent any app from starting with Windows, or re-enable the earlier disabled app. The table here lists all the apps that start automatically when you sign in to your user account, including the appropriate Registry entries and the Startup folder shortcuts. Besides the options to manage the app start, the page also shows last BIOS time. The table includes the following data.
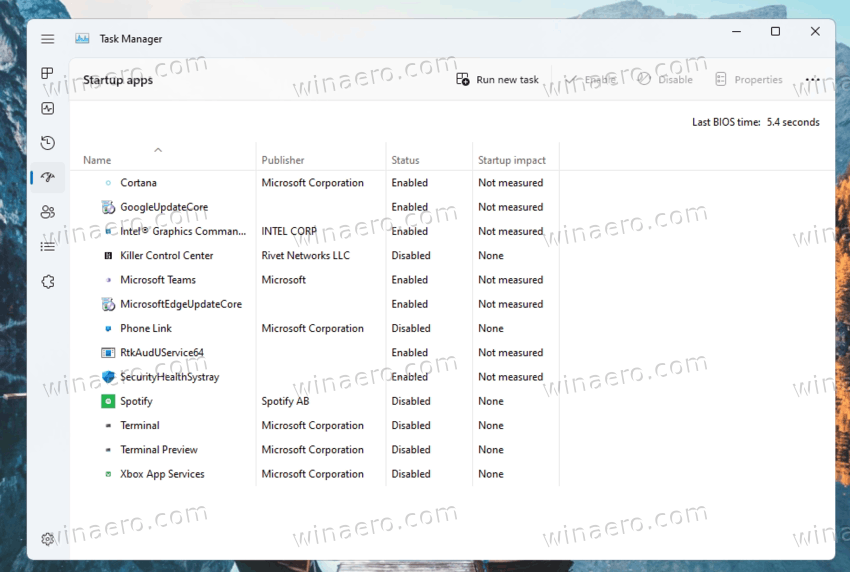
- Name. The app name taken from the Registry or name of the program.
- Publisher. Visible by default. Here you will usually see the app's developer name.
- Status. Visible by default. The most important column on this page. It says "Enabled" for apps that are allowed to start with Windows, and "Disabled" for the processes you have prevented from the starup.
- Startup Impact. Visible by default. Allows you to see how intensive the app utilizes CPU and disk when starts. It may "High", "Low", "None" for disabled apps, and "Not measured" for apps that didn't start a once. Heavy apps with the "High" impact will slowdown Windows and make it start longer. Here you can learn more about how Task Manager calculates the startup impact.
- Startup Type. Hidden by default. Shows from which startup location the app runs with Windows. It can say either "Registry" or "Folder."
- Disk I/O at Startup. Hidden by default. Represents the disk activity by the program in MB at startup.
- CPU at Startup. Hidden by default. The column shows the CPU load by the app when it starts with Windows.
- Running Now. Hidden by default. Says "Running" for the processes that are still currently running. Such processes usually run in the background, and often have tray icons.
- Disabled Time. Hidden by default. Here you will see the date and time when you disabled the program
- Command Line. Shows the full path to the executable file of the app with its command line arguments (if any).
Users
This Task Manager's page shows details for user accounts currently signed in to Windows. You will find their resource usage summarized and in-detail per app. You can expand each row with the summarized user view, and see all the details for each of its running app.
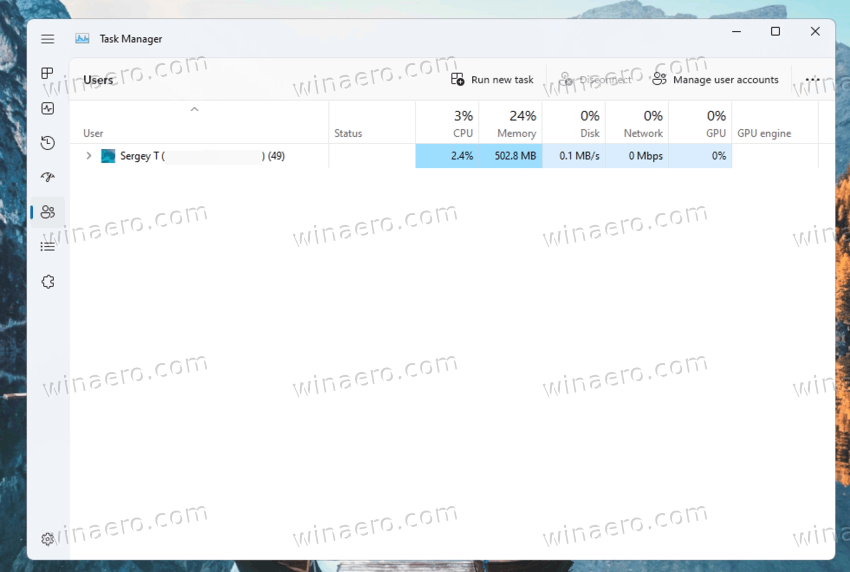
The available columns are:
- ID. Hidden by default. Windows assigns a unique number identifier to each of the signed-in user. The signed-in user account is a "session". Even system processes and services run into their own session 0. By enabling the ID column you can see the session number for each of the signed-in user.
- Session. Hidden by default. Shows the way the user is connected to the system. For users logged in locally it says "Console". For users connected via RDP it will say "RDP-tcp#<number of connection>", and so on.
- Client Name. Hidden by default. For RDP connections this column will contain the remote computer name.
- Status. Visible by default. For locked screens and disconnected RDPs it will say "Disconnected."
- CPU. Visible by default. The total amount of CPU resources consumed by all apps running under the user account.
- Memory. Visible by default. Total RAM used by all apps running under the user account.
- Disk. Visible by default. Disk activity caused by all apps running under the user account.
- Network. Visible by default. Network traffic summary for all user's apps.
- GPU. Visible by default. Video resource usage summary by user's apps.
- GPU Engine. Visible by default. Shows what graphic type is mostly used, e.g. 3D.
Besides, you can right-click any user account in the table and select "Disconnect" from the context menu. This will disconnect the user session but keep the running apps intact. They will remain running under that user's credentials. From the same context menu you can select "Sign off" to forcibly end the user session and terminate all its apps and processes.
These options are useful when you have multiple remote users connected to your PC, e.g. over the LAN or Internet.
For an average home PC, the Users table only lists one (current) account.
Details
This page shows advanced details on every single app that runs on Windows. If you remember the classic Task Manager, it had the same tab but it was named "Processed", and was the first tab in the app. Well, the newer Task Manager has a different "Processes" page, and the classic one has been renamed to "Details" since Windows 8.
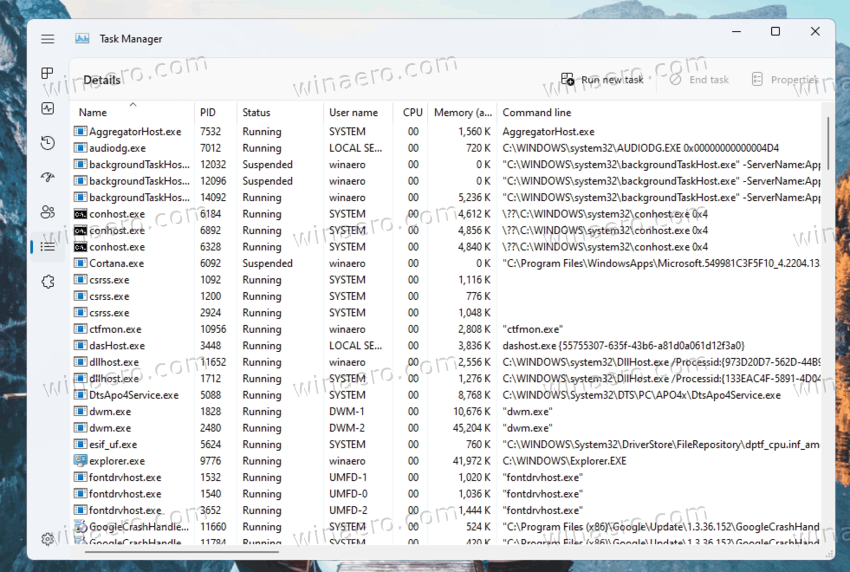
Here you will find information on all system and user processes. The grid on the Details page can have a huge number of columns. They are so many so they do not fit into the context menu. So when you right-click a column title and pick "Select columns," you will see an extra dialog where you can enable or disable columns with checkboxes. The available columns are as follows.
- Package Name. Hidden by default. Shows the identifier assigned to the package for Microsoft Store apps. Each of them has an unique identifier so that the OS can manage the apps efficiently.
- PID. Visible by default. Similar to the first page (Processes), it shows the unique process ID number.
- Status. Visible by default. This column shows if the app is running or it is suspended. Windows puts Store apps and their related processes to the "Suspended" state to free up system resources.
- User name. Visible by default. Shows the user account that runs this or that app and process. This includes your own user account, other users signed in to this PC, and built-in accounts for services and system processes.
- Session ID. Hidden by default. You have seen this number on the Users tab. It is the same unique number for each of the user sessions.
- Job object ID. Hidden by default. In Windows processes can be organized into groups for managing them all at once by the OS. Such a group is called a "job". If the current process is in a job, you will see the unique identifier of that job in this column.
- CPU. Visible by default. Here you will see the percentage of CPU resources used by the current process. In the list, you will see the System Idle row which shows the remaining (free) CPU resources. E.g. a value of 0% System Idle means that CPU is loaded by 100% by the rest of apps.
- CPU time. Hidden by default. The column shows the total amount of time consumed by a process from CPU. If a process was heavily utilizing CPU at some point in the past, you will notice that here, even if now it is in the idle state. However, keep in mind that this value is summarized for running processes only. If you close and then again open the app, this will reset the value in the CPU Time column.
- Cycle. Hidden by default. The percentage of the CPU cycles the process is currently using across all CPUs. It’s unclear exactly how this is different from the CPU column, as Microsoft’s documentation doesn’t explain this. However, the numbers in this column are generally pretty similar to the CPU column, so it’s likely a similar piece of information measured differently.
- Working set (memory). Hidden by default. Displays the amount of physical memory in use by the process.
- Peak working set (memory). Hidden by default. Shows the maximum amount of physical memory used by the process since its start till now.
- Working set delta (memory). Hidden by default. Shows how changed the memory working set since last refresh of the table.
- Memory (active private working set). Visible by default. Shows the amount of memory exclusively occupied (non-shared) and used by the process. I.e. it displays the amount of memory that the process is currently working with.
- Memory (private working set). Hidden by default. Shows the amount of memory exclusively occupied by the process, including caches and memory the process is not reading/writing at the moment of time.
- Memory (shared working set). Hidden by default. The shared physical memory which can be used by other processes when needed.
- Commit size. Hidden by default. The amount of memory of the page file allocated for the process (paged memory).
- Paged pool. Hidden by default. Shows the usage of the paged memory.
- NP pool. Hidden by default. The amount of memory that can't be paged, e.g. critical parts of the OS and its components.
- Page faults. Hidden by default. The number of page faults for the process. They occur when the app access some memory without allocation.
- PF Delta. Hidden by default. Change in the number of page faults since the last update.
- Base priority. Hidden by default. Shows the priority of the current process, Low, Normal, or High.
- Handles. Hidden by default. The total number of numeric identifiers for open files by the process.
- Threads. Hidden by default. The number of threads created by the process. A thread is the basic unit to which the operating system allocates processor time. A thread can execute any part of the process code, including parts currently being executed by another thread.
- User objects. Hidden by default. The number of “window manager objects” used by the process. This includes windows, menus, and cursors.
- GDI objects. Hidden by default. The number of Graphics Device Interface objects used by the process. These are used for drawing the user interface.
- I/O reads. Hidden by default. The column shows the number of file, network, a device reads done by the process since its start. While I/O means input-output, this column only shows read operations.
- I/O writes. Hidden by default and shows how many write operations were done by the process since it started.
- I/O other. Hidden by default. The number of OTHER I/O operations, i.e. not related to reading and writing, for the process.
- I/O read bytes. Hidden by default. The amount of read data in bytes, calculated since its start.
- I/O write bytes. Hidden by default. The amount of written data in bytes, calculated since its start.
- I/O other bytes. Hidden by default. The value data in bytes for other I/O operations, e.g. for management functions.
- Image path name. Hidden by default. The full path to the *.exe file of the process.
- Command line. Hidden by default. The command with that the process was launched, including its options and arguments.
- Operating system context. Hidden by default. The minimum operating system the program supports. Modern apps have a special manifest definition file, that specifies the minimum supported OS version. Many apps do not have such a file, so they may have an empty value in this column.
- Platform. Hidden by default. The target platform for the process, ARM, x86, AMD64.
- Architecture. Visible by default. Shows if it is a 32-bit or 64-bit process.
- Elevated. Hidden by default. Whether the process is running as Administrator.
- UAC virtualization. Hidden by default. Shows if UAC is enabled for the process. If enabled, Windows provides the app with write access to a copy of Registry and file system which are now write-protected by default with process privileges. This allows legacy apps run without administrative privileges under a regular user account. The column may show the following values: Enabled, Disabled, and Not Allowed.
- Description. Visible by default. A description set by developer that is read from resources of app's executable file. The same line is displayed in the "Name" column on the first Processes section.
- Data execution prevention: Shows if Data Execution Prevention (DEP) is enabled or not for the process.
- Enterprise context. Hidden by default. The column shows what the process can do with your enterprise resources. Values are: <domain name> - app can access work resources, “Personal” - the app can't access any work data, “Exempt” for Windows system processes and their components.
- DPI awareness. Hidden by default. Shows if the app goes well with HiDPI displays and high resolutions.
- Power throttling. Hidden by default. To optimize power consumption, a special smart algorithm in Windows detects active user tasks and keeps them running, while all other processes will be throttled.
- GPU. Hidden by default. Shows the GPU resource usage percentage by the app.
- GPU engine. Hidden by default. The column shows which GPU engine the app is using, e.g. 3D for games, VideoDecode for media apps, and others.
- Dedicated GPU memory. Hidden by default. The amount of GPU's on-board memory (or part of RAM dedicated to an integrated GPU) used by the current app.
- Shared GPU memory. Hidden by default. The amount of GPU shared memory (part of RAM shared with the GPU hardware) used by the current app.
- Hardware-enforced stack protection. Hidden by default. Shows Enabled or Disabled. Enabled apps will use the CPU hardware to protect their code while running on the CPU's memory.
- Extended Control Flow Guard. Hidden by default. Control Flow Guard is another memory protection feature that applies tight restrictions on where an application can execute code from. This allows to protect the code from vulnerabilities like buffer overflow. Can show either Enabled or Disabled.
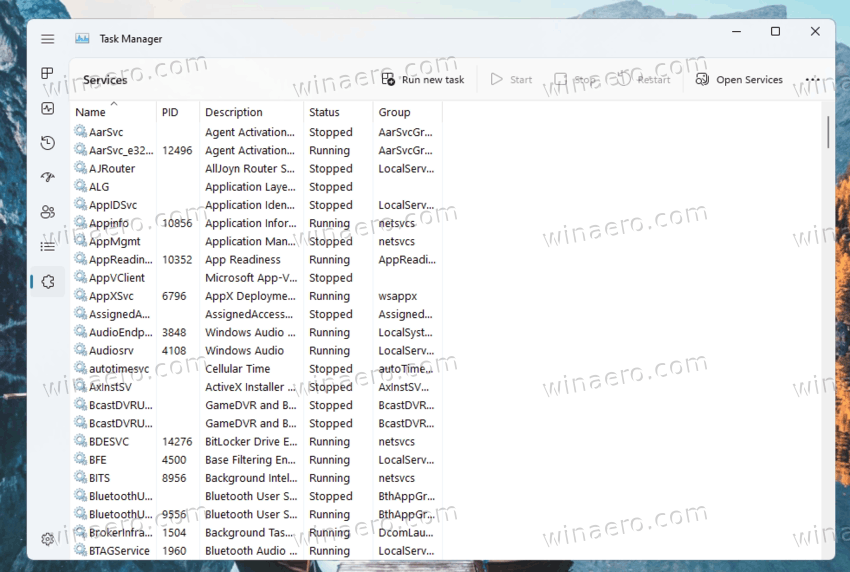
Services
The Services page of the Task Manager lists all the services registered in your operating system. A service is a special app that is designed to always run the background. Services rarely interact with users directly. Most of them run with high privileges and work in pair with device drivers and complex apps.
Here on this page you can start, stop, restart, or disable a service, learn more about it from its properties. Tip: Windows 11 also includes a dedicated "Services" application, a MMC snap-in that allows you to do the same.
Also, from there, you can find which process have been started by the service. For that, right-click a service in the table and select "Go to Details" from the context menu.
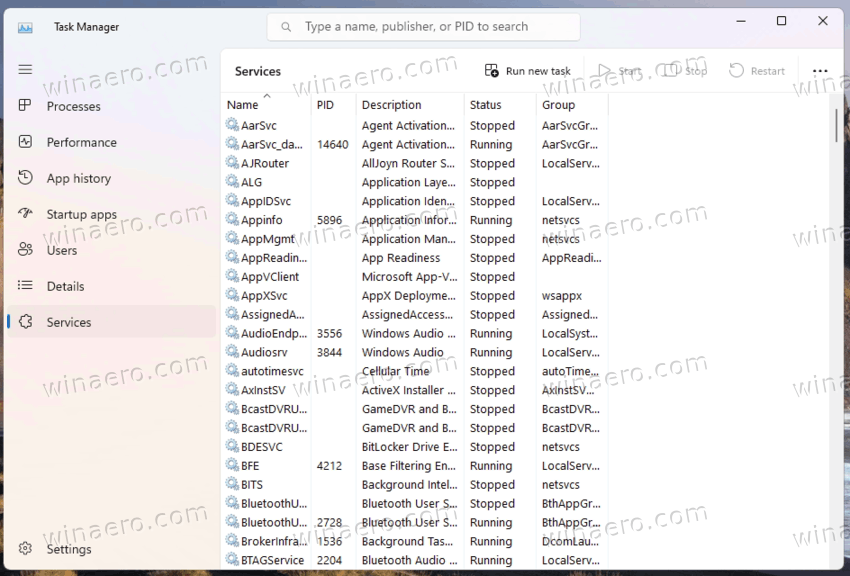
The "Services" page of Task Manager has only a few columns. They are all visible by default. The user cannot customize them. The columns are as follows.
- Name. A human-readable name of the service.
- PID. An unique number that identifies the service process.
- Description. Some extra text that gives you an idea what exactly does the service.
- Status. Shows if the service is disable, running, or stopped. The appropriate text will be shown in this column.
- Group. Windows loads some service in a batch. For that, there are "groups" of services. If the service is part of such a group, this will be reflected here.
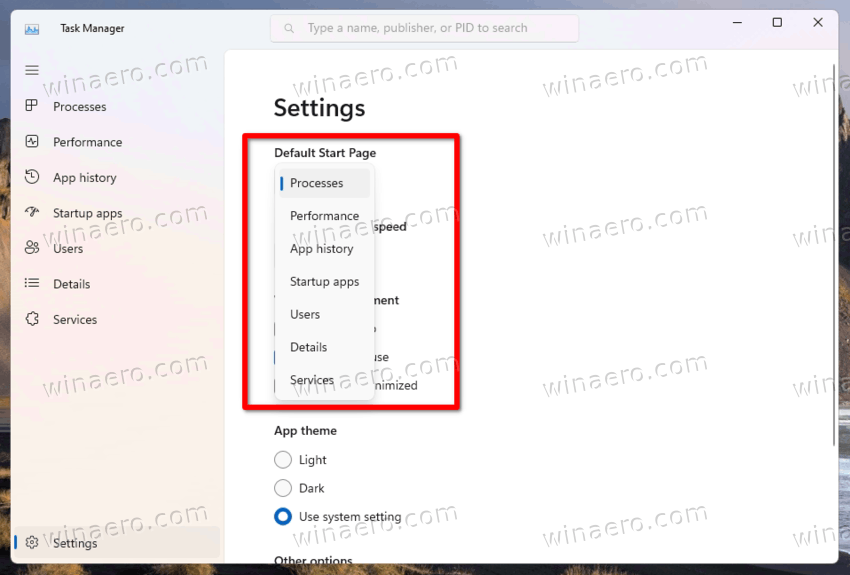
Change Task Manager Settings
Modern Task Manager has a dedicated settings page. There you will find essential configuration options for extra convenience.
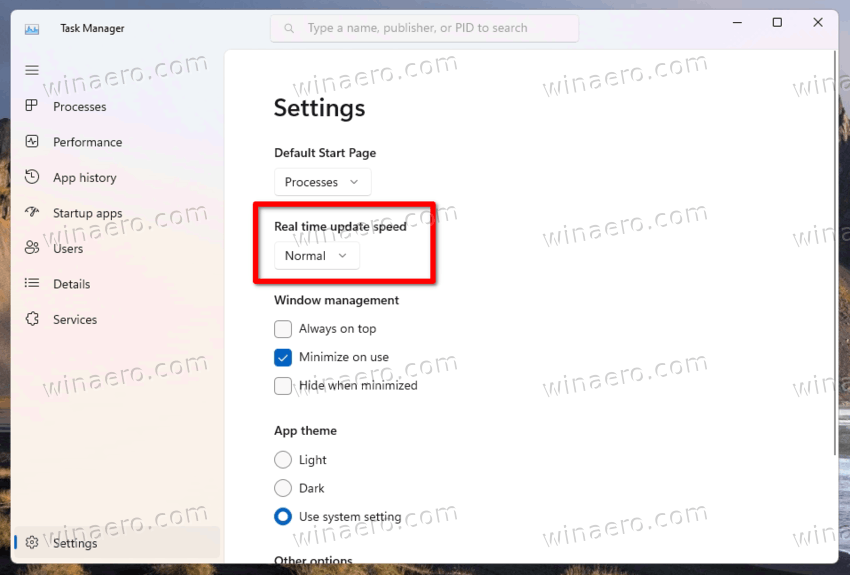
Default Start Page
This option specifies what page the Task Manager opens by default. It starts with Processes, but you can set it to anything else. For example, if you use Task Manager for startup app management, you can select the appropriate option from the drop-down list. We have a dedicated tutorial on this topic.
Besides the start page, the Task Manager settings allow you to adjust a few more options.
Real time update speed
This option of the Task Manager allows you to specify how often it should update the column contents. You can select High, Normal, and Low from the drop-down menu. The last option, Paused, will stop column updates, so the visible information will be frozen.
Always on top
Makes Task Manager always stay above all other windows. This allows you to see the processes all the time.
Minimize on use
The name of this option is not clear for a user that aren't familiar with Task Manager. Here's what it does. When you enable this option, the task manager goes to the taskbar minimized after you select "switch to" for running app in the Processes tab.
Hide when minimized
When the user enables this option, the minimized Task Manager will go to the tray icon area (taskbar overflow). Its taskbar button will disappear. The tray icon in the notification area will be the only icon that indicates the app running. To open the hidden app window you need to double-click on that notification area icon.
It will also show the CPU load right in the tray icon. The latter can be useful if you need to quickly trace performance of some app.
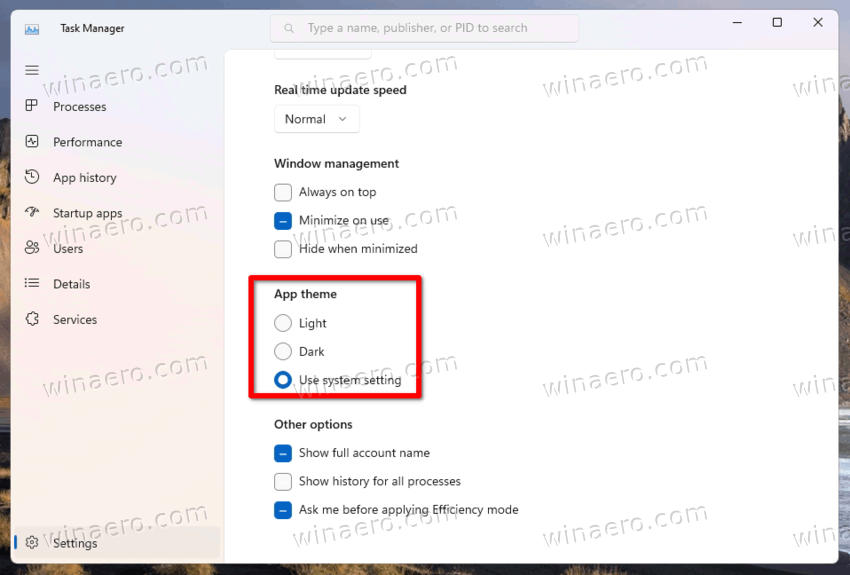
App theme
Use these options to override the options set in Settings > Personalization > Colors. You can make it always use the light or dark theme. By default it follows the "app mode" option in Settings, as shown in my screenshot.
Show full account name
This check box allows makes the app to show extra details on the Users tab.
- When the option is not enabled, the Task Manager will only show the login name for a local account, or email for a Microsoft Account for each of the signed in users.
- Otherwise, it will also show the user's real name, surname and other details you could fill for your user account when created it.
Show history for all processes
This option controls how many apps you can see on the App history page. When it is unchecked (disabled), the page only shows apps that you have been running at least once.
Otherwise, it will display every app known to Windows 11, including the classic Win32 desktop apps.
By default, you will see only the Store apps here, and built-in apps that receive updates from there, like Notepad and Paint.
Ask before applying efficiency mode
This option enables or disables a prompt that appears when you turn on the Efficiency mode (Power throttling) for a process. If you enable this feature, you'll see an extra prompt.
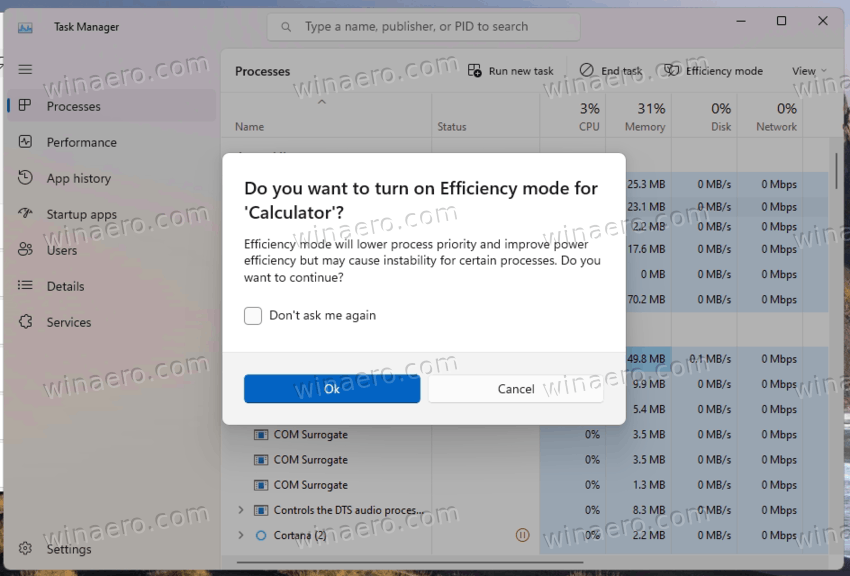
Disabling it will make Task Manager enable process power throttling directly.
Finally, once you customized your Task Manager, you may want to make a backup copy of your preferences. As we learned today, the app stores its settings in the Registry, so it is enough to export them to a REG file, and import when needed.
Backup Task Manager settings
- Close the Task Manager.
- Open the Registry Editor app (Win + R >
regedit> Enter). - Go to the HKEY_CURRENT_USER\Software\Microsoft\Windows\CurrentVersion\TaskManager key. You can copy and paste this path into the address bar of regedit.
- Now, right-click the TaskManager section on the left, and select Export from the menu.
- In the Save file dialog, browse for the folder where you want to store your Task Manager options, and type the file name, e.g.
TaskManagerSettings.reg.
Done! You now have a backup copy of your Task Manager settings.
If you need to create it from the Command Prompt, or say by a schedule, you may like the following command.
Backup Task Manager settings in Command Prompt
Open a new command prompt or Terminal. You can quickly open the latter by pressing Win + X and selecting Terminal from the menu.
In Terminal, type the following command:
reg export HKCU\Software\Microsoft\Windows\CurrentVersion\TaskManager c:\users\winaero\desktop\taskmanagersettings.reg
Change the path to the taskmanagersettings.reg file to the folder where you will store the backup, and press Enter.
At any moment later, you can quickly restore its settings by double-clicking the REG file you just created.
Restore Task Manager settings from a backup
- Close the Task Manager.
- Open the folder that stores your
TaskManagerSettings.regfile, and double click it. - Confirm the operation by clicking Yes in the User Account Control dialog, and then clicking OK to confirm the addition of the information to the Registry.
- Now, open the Task Manager. It should now have all the customizations included in your backup.
Finally, if you aren't happy much with what you have done to the Task Manager, there is a quick way to reset its settings to defaults, all at once. Here we go.
Reset Task Manager Settings in Windows 11
- Close the Task Manager.
- Run the regedit.exe app.
- Browse the Registry editor to the HKEY_CURRENT_USER\Software\Microsoft\Windows\CurrentVersion\TaskManager key.
- Right-click the TaskManager folder in the left tree area, and select Delete from the menu. Confirm the key removal.
- Now, open the Task Manager. Voila, all its settings will be now set to their defaults.
Done!
Tip: if you prefer a one-liner command for resetting the settings of the Task Manager, you can do it as follows.
Reset Task Manager from the command prompt
Close the Task Manager, and open a new Command Prompt. Now, type or copy-paste the following command:
reg delete HKCU\Software\Microsoft\Windows\CurrentVersion\TaskManager
This will instantly reset the app's settings.
That's all about the Task Manager customization on Windows 11. If you still have some questions or suggestions, don't hesitate to leave a comment.
Support us
Winaero greatly relies on your support. You can help the site keep bringing you interesting and useful content and software by using these options:

Exporting the settings from the registry does not work with the new task manager from Windows 11 22H2. The settings are not stored there, so your article is not correct.
With the latest Win 11 versions, the task manager setting are in:
C:\Users\….\AppData\Local\Microsoft\Windows\TaskManager\settings.json
Happy trail