DTrace is the popular open source debugging and diagnostic tool. It has originally been built for Solaris, and became available for Linux, FreeBSD, NetBSD, and macOS. Microsoft has ported it to Windows, and adds a portion of updates to it with 20H1 feature update.
Advertisеment
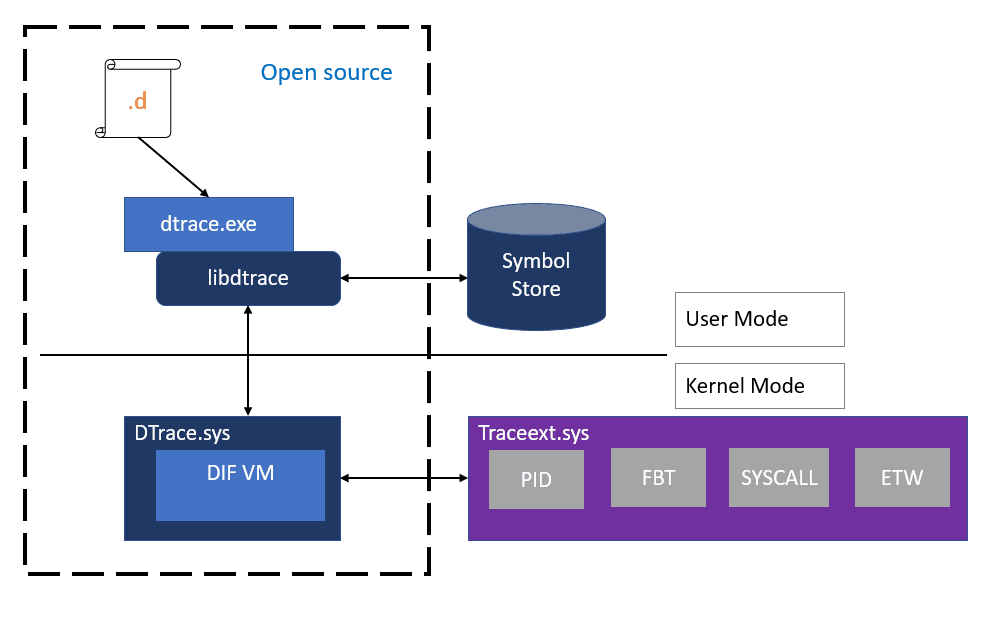
DTrace is a dynamic tracing framework that allows an admin or developer to get a real-time look into a system either in user or kernel mode. DTrace has a C-style high level and powerful programming language that allows you to dynamically insert trace points. Using these dynamically inserted trace points, you can filter on conditions or errors, write code to analyze lock patterns, detect deadlocks, etc.
On Windows, DTrace extends Event Tracing for Windows (ETW) which is static and does not provide the ability to programmatically insert trace points at runtime.
All APIs and functionality used by dtrace.sys are documented calls.
Microsoft has implemented a special driver for Windows 10 that allows performing a number of system-monitoring roles. The driver is built in Windows 10 starting in version 1903.
Starting in Windows 10 insider build 19041.21, DTrace comes with the following improvements.
ARM64 preview
Yes, that’s right! DTrace now supports ARM64 in preview mode. The ARM64 MSI is available in the download link listed above.
You can use it on your Surface Pro X running the latest Windows 10 Insider Preview (20H1) build, starting with 19041.21.
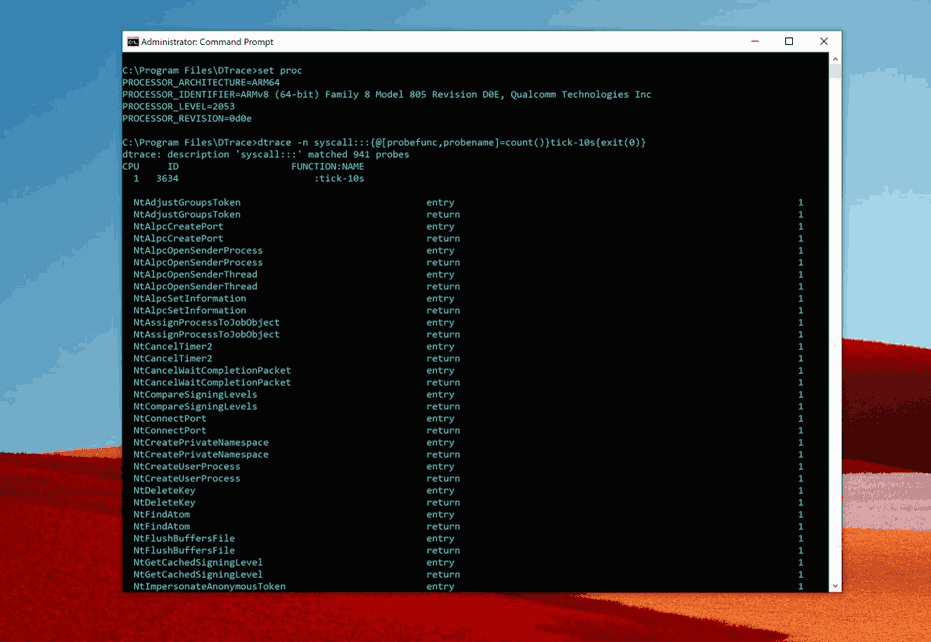 DTrace on Surface Pro X
User mode Stackwalk
In the preview, the stackwalk facility in DTrace was limited to Kernel mode (stack). This update adds support for usermode stackwalk facility (ustack). Like stack, ustack facility is fully compatible with open source DTrace specification. It can be invoked in three ways by specifying frames (depth) & size (ignored for now) or void.
- Ustack(nframes, size)
- Ustack(nframes)
- Ustack()
While ustack () can determine the address of the calling frame when probe fires, the stack frames will not be translated into symbols until the ustack () action is processed at user-mode by DTrace consumer. Symbol download can slow down the output. Hence, it’s better to use this facility with locally cached symbols like below.
dtrace -n "profile-1ms /arg1/ {ustack(50, 0); exit(0);} " -y C:\symbols
dtrace: description 'profile-1ms ' matched 1 probe
CPU     ID                    FUNCTION:NAME
  0   3802                     :profile-1ms
              ntdll`ZwAllocateVirtualMemory+0x14
              ntdll`RtlAllocateHeap+0x3ded
              ntdll`RtlAllocateHeap+0x763
              ucrtbase`malloc_base+0x44
Live dump support
Windows commonly uses something called Live dump to help quickly diagnose issues. Live dumps help with troubleshooting issues involving multiple processes or system wide issues without downtime. In 20H1, DTrace on Windows can be used to capture a live dump from inside a D-script using the lkd() DTrace facility. A common use case of this facility is to instrument error path (like return code indicates a failure) and capture a live dump right at the failure point for advanced diagnostics. For more information on live dump support, see DTrace Live Dump.
dtrace -wn "syscall:::return { if (arg0 != 0xc0000001UL) { lkd(0); printf(\" Triggering Live dump \n \");exit(0); }}"
dtrace: description 'syscall:::return ' matched 1411 probes
dtrace: allowing destructive actions
CPU     ID                    FUNCTION:NAME
  0    181     NtDeviceIoControlFile:return  Triggering Live dump


dir c:\Windows\LiveKernelReports
 Volume in drive C has no label.
 Volume Serial Number is 70F4-B9F6

 Directory of c:\Windows\LiveKernelReports

11/05/2019  05:20 PM    <DIR>          .
11/05/2019  05:20 PM    <DIR>          ..
11/05/2019  05:19 PM    <DIR>          DTRACE
11/05/2019  05:20 PM        53,395,456 DTRACE-20191105-1720.dmp
ETW Tracing
ETW tracing is the most frequently used tool for debugging on Windows. In DTrace on Windows 19H1 preview, we added support for instrumenting tracelogged and manifested events using the ETW provider.
In 20H1, we further enhanced this facility to create new ETW events on the fly from inside a D-script using the ETW_Trace() facility. This helps in situations where existing ETW events are insufficient and you would like to add additional ETW trace points without modifying production code.
For more information about ETW_Trace facility and ETW provider, see DTrace ETW.
/*
Running the GitHub ETW provider sample (link below) to print node memory info event.
https://github.com/microsoft/DTrace-on-Windows/blob/master/samples/windows/etw/numamemstats.d
*/

dtrace -qs numamemstats.d

Partition ID: 0
Count: 1
Node number: 1
m_nodeinfo {
    uint64_t TotalPageCount = 0x1fb558
    uint64_t SmallFreePageCount = 0x41
    uint64_t SmallZeroPageCount = 0
    uint64_t MediumFreePageCount = 0
    uint64_t MediumZeroPageCount = 0
    uint64_t LargeFreePageCount = 0
    uint64_t LargeZeroPageCount = 0
    uint64_t HugeFreePageCount = 0
    uint64_t HugeZeroPageCount = 0
}
If you are interested in installing DTrace, check out how it can be done here.
You can download the updated DTrace MSI package from here.
Here is it source code and advanced scripts.
Support us
Winaero greatly relies on your support. You can help the site keep bringing you interesting and useful content and software by using these options:
