Microsoft is rolling out the graphing mode feature to the public. The new feature will allow visualizing equations, and will be helpful to students who learn linear algebra.
Advertisеment
In Windows 10, Microsoft replaced the good old calculator with a new Modern app. Microsoft has opened its source code, that allows the app to be ported to Android, iOS, and Web. Now, the company adds a new feature, Graphing Mode, to Windows 10 Calculator.
Tip: You can launch Calculator directly as described in the following article: Run Calculator in Windows 10 directly.
The modern Calculator app constantly receives improvements. Some time ago it has got a Currency Converter. Also, Microsoft has added the Always on Top feature. The Always on Top feature of the app will allow Calculator remain always visible on the screen in the system at all times.
The new Graphing Mode was first introduced at company's 'Live from BETT'. Microsoft has announced it as follows.
Adding support for graphing was one of our top feature requests, so we’re excited to bring this feature to our users. Graphing capabilities are also essential for students who are beginning to explore linear algebra. With this feature, we hope to empower students to learn mathematics by improving their conceptual understanding and attitudes towards math.
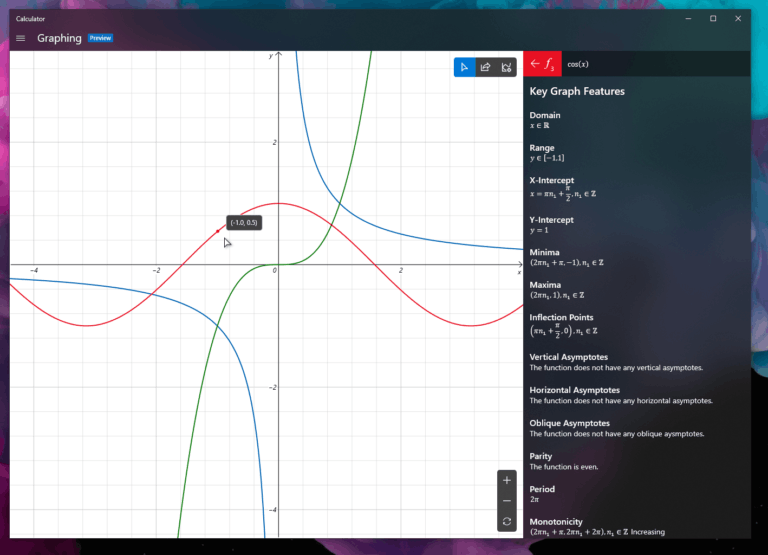
The key features of Graphing Mode are as follows.
Graphing Mode
- Plot one or more equations on the graph. Enter multiple equations so that you can compare plots against each other and see interactions between the lines. You can also customize the line style and graph viewing window to suit your needs.
- Add equations with variables. If you enter an equation with a secondary variable (e.g., “y = mx + b”), you’ll be able to easily manipulate those variables so that you can quickly understand how changes to the equation affect the graph.

- Analyze the graph. Trace plots with your mouse or keyboard to better understand the relationship between variables in the equation on the graph. You can also analyze equations to help identify key graph features, like the x- and y- intercepts.
Support us
Winaero greatly relies on your support. You can help the site keep bringing you interesting and useful content and software by using these options:
