The next Windows 10 feature update (19H1, April 2019 Update, version 1903) will include support for DTrace, the popular open source debugging and diagnostic tool. It has originally been built for Solaris, and became available for Linux, FreeBSD, NetBSD, and macOS. Microsoft has ported it to Windows.
Advertisеment
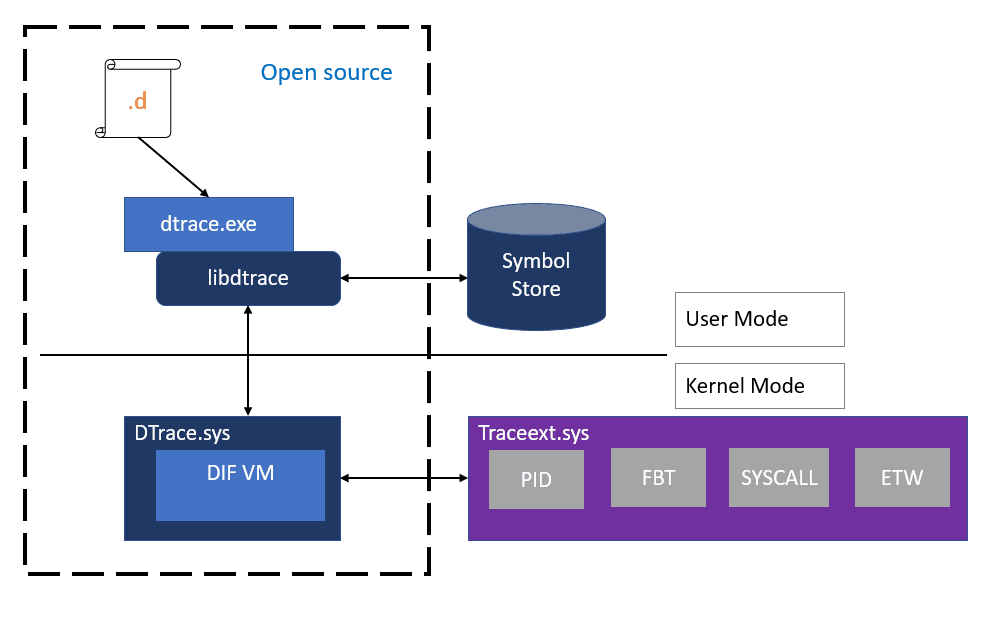
DTrace is a dynamic tracing framework that allows an admin or developer to get a real-time look into a system either in user or kernel mode. DTrace has a C-style high level and powerful programming language that allows you to dynamically insert trace points. Using these dynamically inserted trace points, you can filter on conditions or errors, write code to analyze lock patterns, detect deadlocks, etc.
On Windows, DTrace extends Event Tracing for Windows (ETW) which is static and does not provide the ability to programmatically insert trace points at runtime.
All APIs and functionality used by dtrace.sys are documented calls.
Microsoft has implemented a special driver for Windows 10 that allows performing a number of system-monitoring roles. The driver will be included with Windows 10 version 1903. Also, DTrace currently requires Windows to be started with a kernel debugger enabled.
The source code for the ported DTrace tool is available on GitHub. Visit the page “DTrace on Windows” under the OpenDTrace project on GitHub to see it.
Setup DTrace in Windows 10
Prerequisites for using the feature
- Windows 10 insider build 18342 or higher
- Only available on x64 Windows and captures tracing info only for 64-bit processes
- Windows Insider Program is enabled and configured with valid Windows Insider Account
- Visit Settings->Update & Security->Windows Insider Program for details
Instructions:
- BCD configuration set:
- bcdedit /set dtrace on
- Note, you need to set the bcdedit option again, if you upgrade to a new Insider build
- Download and install the DTrace package from download center.
- This installs the user mode components, drivers and additional feature on demand packages necessary for DTrace to be functional.
- Optional: Update the PATH environment variable to include C:\Program Files\DTrace
- set PATH=%PATH%;"C:\Program Files\DTrace"
- Setup symbol path
- Create a new directory for caching symbols locally. Example: mkdir c:\symbols
- Set _NT_SYMBOL_PATH=srv*C:\symbols*http://msdl.microsoft.com/download/symbols
- DTrace automatically downloads the symbols necessary from the symbol server and caches to the local path.
- Optional: Setup Kernel debugger connection to the target machine (MSDN link). This is only required if you want to trace Kernel events using FBT or other providers.
- Note that you will need to disable Secureboot and Bitlocker on C:, (if enabled), if you want to setup a kernel debugger.
- Reboot target machine
Using DTrace
- Open an elevated command prompt.
- Execute one of the following commands:
# Syscall summary by program for 5 seconds:
dtrace -Fn "tick-5sec { exit(0);} syscall:::entry{ @num[pid,execname] = count();} "

# Summarize timer set/cancel program for 3 seconds:
dtrace -Fn "tick-3sec { exit(0);} syscall::Nt*Timer*:entry { @[probefunc, execname, pid] = count();}"

# Dump System Process kernel structure: (requires symbol path to be set)
dtrace -n "BEGIN{print(*(struct nt`_EPROCESS *) nt`PsInitialSystemProcess);exit(0);}"

# Tracing paths through NTFS when running notepad.exe (requires KD a
The command dtrace -lvn syscall::: will list all the probes and their parameters available from the syscall provider.
The following are some of the providers available on Windows and what they instrument.
- syscall – NTOS system calls
- fbt (Function Boundary Tracing) – Kernel function entry and returns
- pid – User-mode process tracing. Like kernel-mode FBT, but also allowing the instrumentation of arbitrary function offsets.
- etw (Event Tracing for Windows) – Allows probes to be defined for ETW This provider helps to leverage existing operating system instrumentation in DTrace.
- This is one addition we have done to DTrace to allow it to expose and gain all the information that Windows already provides in ETW.
More sample scripts applicable for Windows scenarios can be found in this samples directory.
Source: Microsoft
Support us
Winaero greatly relies on your support. You can help the site keep bringing you interesting and useful content and software by using these options:
