How to Disable F12 Keyboard Shortcut for Developer Tools in Microsoft Edge
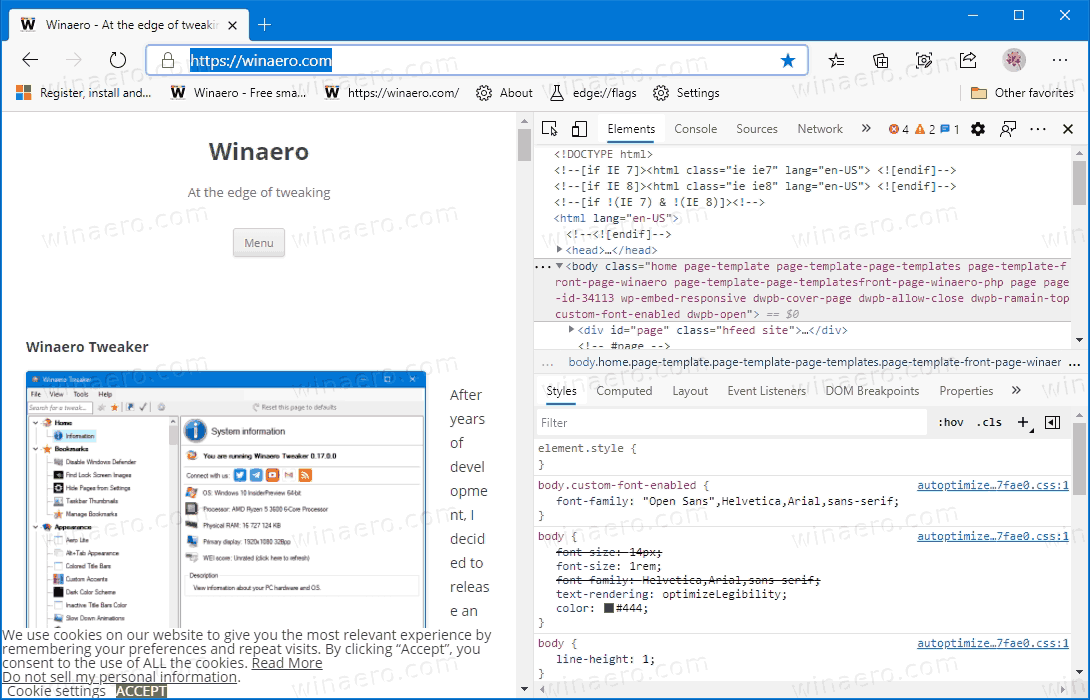
Microsoft Edge allows you to open Developer Tools (DevTools) by pressing the F12 key, or by pressing the Ctrl + Shift + i keyboard shortcut. These are a set of tools that allow you to inspect and debug JavaScript, HTML, and various web applications and pages.
Advertisеment
Microsoft Edge is now a Chromium-based browser with a number of exclusive features like Read Aloud and services tied to Microsoft instead of Google. The browser has already received a few updates, with support for ARM64 devices. Also, Microsoft Edge is still supporting a number of aging Windows versions, including Windows 7. Check out Windows Versions Supported by Microsoft Edge Chromium. Finally, interested users can download MSI installers for deployment and customization.
Microsoft Edge includes a number of tools that can be useful for developers and advanced users. For example, those tools can be used to emulate a different device or software platform. In fact, you can use one of its options to download an official Windows 10 ISO image directly.
What's available in Edge Developer Tools
With DevTools, you are able to do the following, all in the browser.
- Inspect and make changes to your HTML website
- Edit CSS and instantly see preview how your website renders
- See all the
console.log()statements from your front-end JavaScript code - Debug your script by setting breakpoints and stepping through it line by line

To open DevTools, press F12, or press Ctrl+Shift+I on Windows/Linux (Command+Option+I on macOS). You can find the official DevTools documentation here.
Available panels
The Microsoft Edge (Chromium) DevTools include the following panels.
- An Elements panel to edit HTML and CSS, inspect accessibility properties, view event listeners, and set DOM mutation breakpoints
- A Console to view and filter log messages, inspect JavaScript objects and DOM nodes, and run JavaScript in the context of the selected window or frame
- A Sources panel to open and live edit your code, set breakpoints, step through code, and see the state of your website one line of JavaScript at a time
- A Network panel to monitor and inspect requests and responses from the network and browser cache
- A Performance panel to profile the time and system resources required by your site
- A Memory panel to measure your use of memory resources and compare heap snapshots at different states of code runtime
- An Application panel to inspect, modify, and debug web app manifests, service workers, and service worker caches. You may also inspect and manage storage, databases, and caches from the Application panel.
- A Security panel to debug security issues and ensure that you have properly implemented HTTPS on your website. HTTPS provides critical security and data integrity for both your site and your users that provide personal information on your site.
- An Audits panel (now renamed Lighthouse) to run an audit of your website. The results of the audit help you improve the quality of your site in the following ways.
- Catch common errors related to making your website accessible, secure, performant, and so on.
- Fix each error.
- Build a PWA.
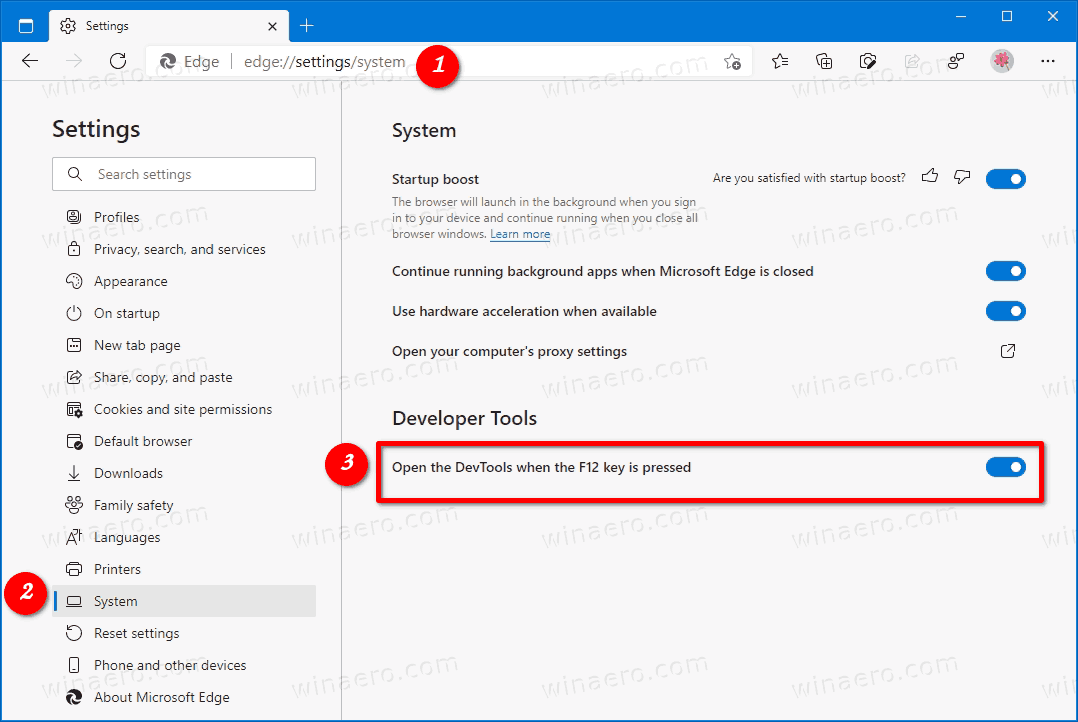
Starting in Edge Canary 89.0.726.0, you can disable the Open the DevTools when the F12 key is pressed option in browser's settings.
This post will show you how to enable or disable the F12 keyboard shortcut for Developer Tools in Microsoft Edge.
To Disable F12 Keyboard Shortcut for Developer Tools in Microsoft Edge
- Open Microsoft Edge.
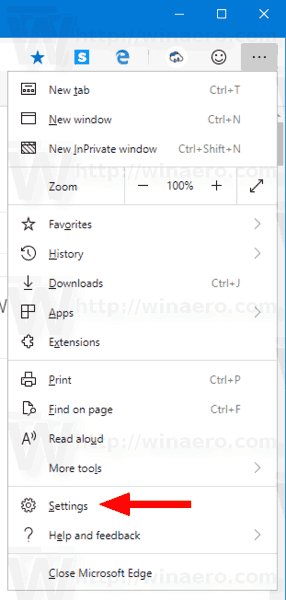
- Click on the Settings button (Alt + F) and select Settings from the menu.

- On the left, click on System, or paste this in the address bar
edge://settings/system. - Scroll down to the Developer Tools section.
- Enable or disable the option Open the DevTools when the F12 key is pressed for what you want.

- You can now close the Settings tab of Microsoft Edge.
You are done.
Support us
Winaero greatly relies on your support. You can help the site keep bringing you interesting and useful content and software by using these options:
